RSS

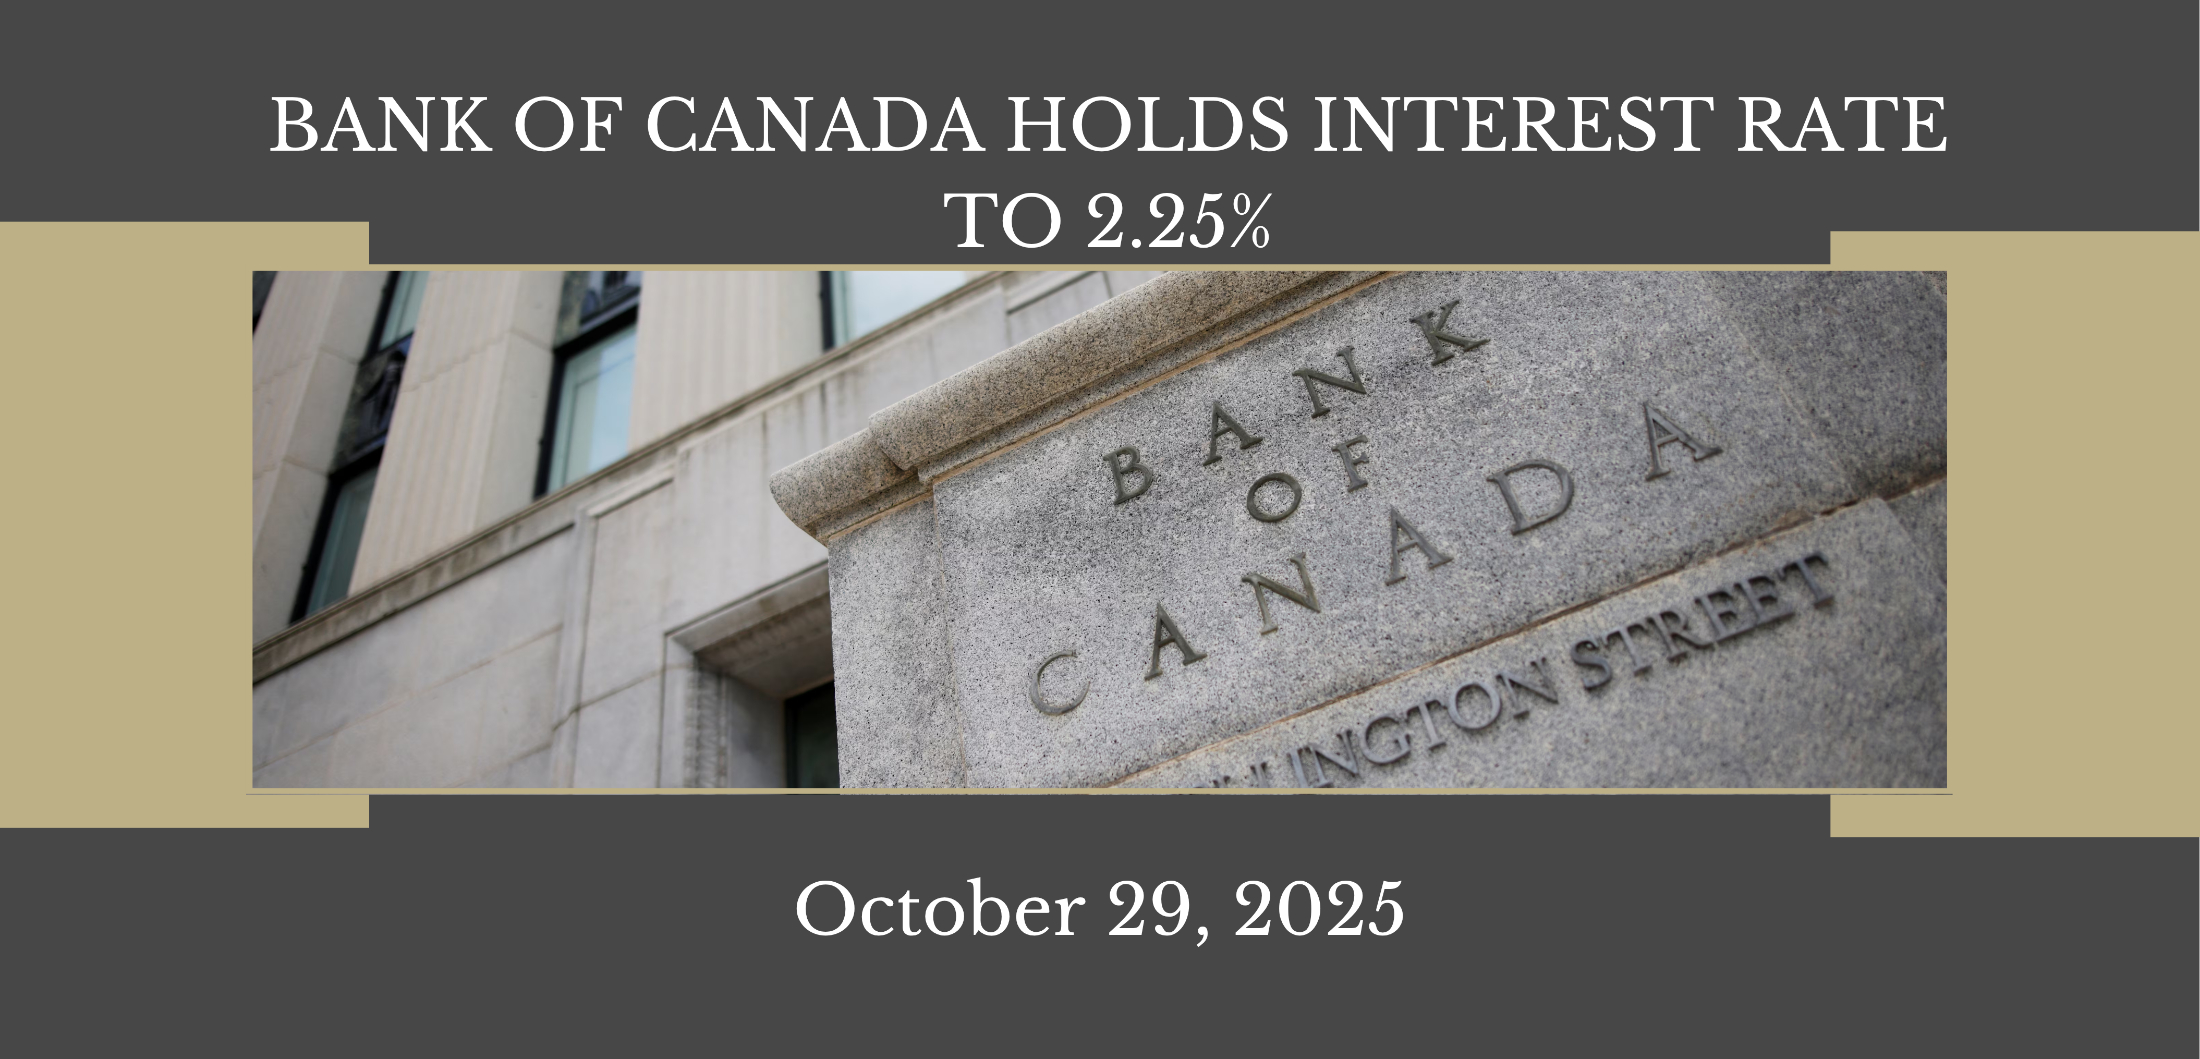
The Bank of Canada Reduces Policy Interest Rate to 2.25%

The Bank of Canada today reduced its target for the overnight rate by 25 basis points to 2.25%, with the Bank Rate at 2.5% and the deposit rate at 2.20%.

With the effects of U.S. trade actions on global economic growth and inflation now somewhat clearer, the Bank has returned to its standard practice of providing a full projection for both the global and Canadian economies in its latest Monetary Policy Report (MPR). However, the Bank notes that “because U.S. trade policy remains unpredictable and uncertainty is still higher than normal, this projection is subject to a wider-than-usual range of risks.”

Globally, the economy has proven resilient in the face of historic U.S. tariff increases, but the impact is becoming more evident. Trade relationships are being reconfigured, and ongoing trade tensions are dampening investment across many countries. According to the MPR, global economic growth is projected to slow from approximately 3¼% in 2025 to around 3% in 2026 and 2027.

In the United States, economic activity remains strong—supported by a boom in AI investment—though employment growth has slowed and tariffs have begun to raise consumer prices. Growth in the euro area is decelerating, driven by weaker exports and slowing domestic demand. Meanwhile, in China, lower exports to the U.S. have been partially offset by stronger exports to other markets, but business investment has weakened.

Global financial conditions have eased since July, oil prices have remained relatively stable, and the Canadian dollar has depreciated slightly against the U.S. dollar.

Domestically, Canada’s economy contracted by 1.6% in the second quarter, reflecting reduced exports and weak business investment amid heightened uncertainty. Household spending, however, continued to grow at a healthy pace. U.S. trade actions and related uncertainty are having a significant impact on targeted Canadian sectors, including autos, steel, aluminum, and lumber. As a result, GDP growth is expected to remain weak in the second half of the year. The Bank anticipates modest support from rising consumer and government spending and residential investment, with growth expected to gradually strengthen as exports and business investment recover.

Labour market conditions remain soft. Employment gains in September followed two months of sizeable losses, while job cuts continue in trade-sensitive sectors. Hiring has been weak across much of the economy, with the unemployment rate holding at 7.1% in September and wage growth slowing. Slower population growth also means fewer new jobs are required to maintain a stable employment rate.

The Bank projects GDP growth of 1.2% in 2025, 1.1% in 2026, and 1.6% in 2027. On a quarterly basis, growth is expected to strengthen in 2026 after a weaker second half of 2025. Excess capacity in the economy is expected to persist and be gradually absorbed over the projection horizon.

Inflationary pressures remain contained. CPI inflation measured 2.4% in September, slightly above the Bank’s previous expectations, while inflation excluding taxes was 2.9%. The Bank’s preferred measures of core inflation remain sticky around 3%. Broader indicators, including alternative core measures and the distribution of price changes across CPI components, suggest underlying inflation is holding near 2½%. The Bank expects inflationary pressures to ease in the coming months, with CPI inflation remaining near 2% through the forecast horizon.

With “ongoing weakness in the economy and inflation expected to remain close to the 2% target,” the Governing Council decided to cut the policy rate by 25 basis points. The Bank noted that “if inflation and economic activity evolve broadly in line with the October projection, Governing Council sees the current policy rate at about the right level to keep inflation close to 2% while helping the economy through this period of structural adjustment.”

“If the outlook changes,” the Bank added, “we are prepared to respond. Governing Council will be assessing incoming data carefully relative to the Bank’s forecast.”

Looking ahead, the Bank emphasized that the Canadian economy faces a challenging transition. The structural damage caused by the ongoing trade conflict has reduced the economy’s capacity and increased costs, limiting the ability of monetary policy to stimulate demand while maintaining low inflation.

In closing, the Bank reaffirmed its commitment to stability, stating that it “is focused on ensuring that Canadians continue to have confidence in price stability through this period of global upheaval.”

Source: bankofcanada.ca

Read

Ottawa Market Shows Resilience in September Amid Rising Inventory and Stable Prices

OTTAWA, October 3, 2025 – Ottawa’s housing market in September continued to follow late-summer seasonal trends, with sales easing slightly while inventory levels continued to climb. A total of 1,089 homes sold, down from 1,236 in August and 1,318 in July. This three-month softening is typical as the spring peak transitions into quieter summer months.

The average sale price in September was $690,397, falling between August’s $686,536 and July’s $695,209, and remaining up 0.3% year-over-year. Benchmark prices have remained relatively stable, indicating that demand is holding steady even as buyers gain more choice.

Active listings rose to 4,388 in September, up from 3,971 in August and 4,205 in July. These elevated inventory levels reflect a shift away from undersupplied pandemic-era conditions toward longer-term balanced market levels, though at elevated levels worth monitoring. Months of inventory edged up to 4.0, compared to 3.2 in both August and July, further illustrating balance between buyers and sellers.

On September 17, the Bank of Canada cut its key policy interest rate by 25 basis points to 2.5%, citing slowing global growth and easing inflation pressures. Combined with Ottawa’s resilient demand and balanced market conditions, this rate cut could encourage first-time buyers and stimulate additional market activity in the coming months.

“September reinforced Ottawa’s resilience, with sales nearly 2.4% higher than last year and prices holding steady despite more listings coming to market,” said Paul Czan, OREB President. “Townhomes are driving stability while single-family homes are easing. And while Ottawa’s diversity of housing continues to increase inventory, missing middle housing—like townhomes—still isn’t being built fast enough, and that’s something OREB continues to advocate for.”

Residential Market Activity
Year-to-date, there have been 11,025 home sales, 3.9% higher than at the same point in 2024. The average sale price in September was $690,397, up 0.3% from last year, with a year-to-date average of $699,910, a 2.7% increase over the first nine months of 2024. Total dollar volume in September reached approximately $751 million, a 2.8% increase year-over-year, continuing to contribute significantly to the Ottawa economy.

On the listings side, 2,832 new residential properties were added in September, up 19.3% from last year. Active listings totaled 4,388 units, up 19.4% from September 2024 and roughly 21.8% above the five-year average. Months of inventory rose to 4.0, reflecting what is generally considered a balanced market.

MLS® Home Price Index
The MLS® HPI composite benchmark price in Ottawa was $627,200 in September, a modest 1.1% increase year-over-year. By property type:

  • Single-family homes: $697,200, up 1.0%

  • Townhouses: $462,800, up 7.8%

  • Apartments: $408,200, down 1.7%

Read

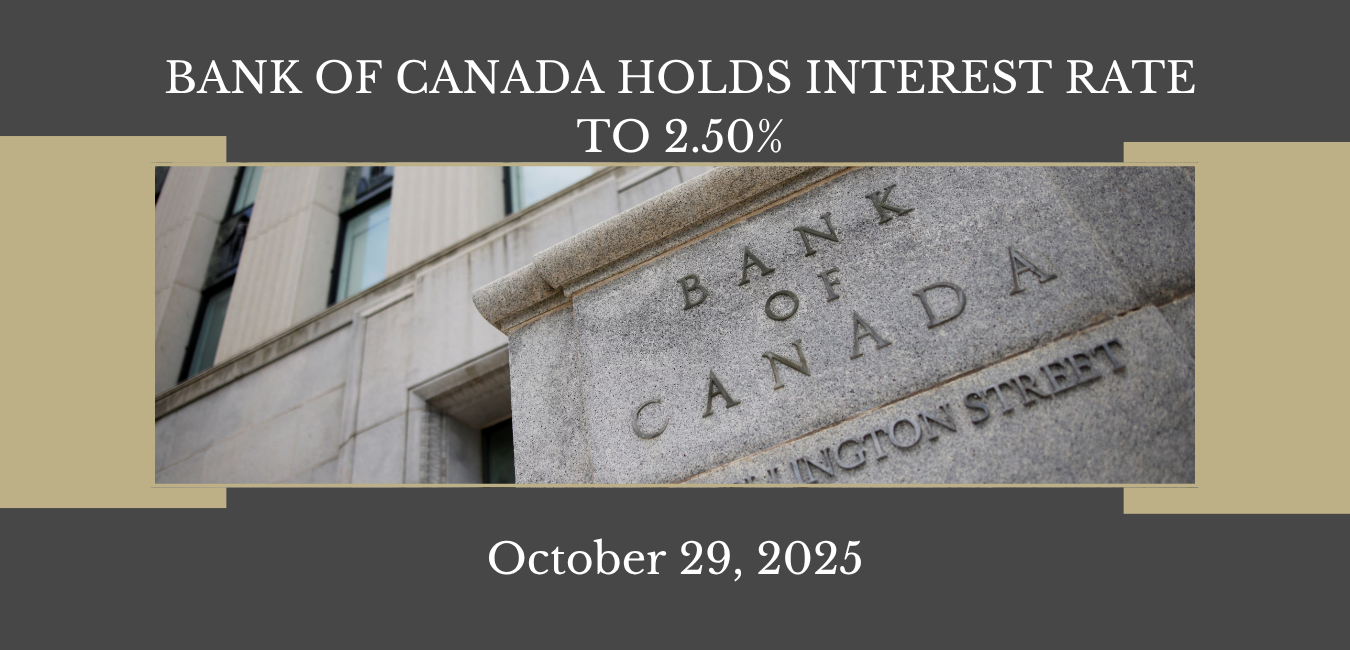
The Bank of Canada Cuts Policy Rate to 2.5% Amid Global Trade Pressures

The Bank of Canada today reduced its target for the overnight rate by 25 basis points to 2.5%, with the Bank Rate at 2.75% and the deposit rate at 2.45%.

Global economic growth, which had remained resilient to sharply higher U.S. tariffs and ongoing uncertainty, is now showing signs of slowing. In the United States, business investment remains strong, but consumers are cautious, and employment gains have slowed. U.S. inflation has increased recently as some tariff costs are passed on to consumer prices. Growth in the euro area has moderated due to the impact of U.S. tariffs on trade. In China, growth held up in the first half of the year but is softening as investment weakens. Global oil prices remain near levels assumed in the July Monetary Policy Report (MPR), while financial conditions have eased further with higher equity prices and lower bond yields. The Canadian dollar has remained stable against the U.S. dollar.

Domestically, Canada’s GDP declined by about 1½% in the second quarter, reflecting the weight of tariffs and trade uncertainty. Exports fell sharply by 27% in Q2 after first-quarter gains driven by pre-tariff orders. Business investment also declined, while consumption and housing activity grew at a healthy pace. Looking ahead, slow population growth and a softening labour market are expected to dampen household spending.

Employment has declined over the past two months since the July MPR, with losses concentrated in trade-sensitive sectors and hiring slowing elsewhere. The unemployment rate increased to 7.1% in August, while wage growth continues to ease.

CPI inflation was 1.9% in August, consistent with July, while inflation excluding taxes was 2.4%. Core inflation measures have remained around 3%, though recent monthly momentum has eased. Broader indicators, including alternative core measures, suggest underlying inflation is running near 2½%. The federal government’s removal of most retaliatory tariffs on U.S. imports is expected to reduce upward price pressure on these goods.

Given the weaker economy and reduced upside risk to inflation, the Governing Council deemed a reduction in the policy rate appropriate to balance risks. The Bank will monitor how trade shifts affect exports, business investment, employment, household spending, and inflation expectations.

The Bank reaffirmed its commitment to price stability and economic growth, stating it will continue to support Canadians “through this period of global upheaval” while keeping inflation well controlled.

Read

Ottawa Housing Market Shows Resilience with Steady Prices and Balanced Supply in July

OTTAWA, August 7, 2025 – Ottawa’s housing market continues to demonstrate steady demand, moderate price growth, and a healthy level of supply—even as other markets experience increased volatility.

Some Ontario markets are encountering more pronounced slowdowns, with declining sales, price corrections, and rising inventory levels outpacing demand. Historically, Ottawa has been somewhat insulated from such extremes due to its stable employment base and consistent population growth, but broader provincial or national trends can still influence the local market over time.

The recent rise in active listings, both year-over-year and compared to the five-year average, may signal early supply pressure. At the same time, the sales-to-new-listings ratio increased from 51.7% to 55.1% compared to last year, indicating that demand is keeping pace with supply. For now, this rise in inventory gives buyers more choice, but it is a trend worth monitoring.

“While we’ve seen demand softening in the condo market, especially in the downtown core, Ottawa’s real estate market continues to stand out for its resilience and stability,” says Paul Czan, President of the Ottawa Real Estate Board (OREB). “With steady demand, balanced inventory, and moderate price growth, our fundamentals remain strong. We’re keeping a close eye on changing dynamics and will continue providing transparent insights to help our Members and the public navigate the market with confidence.”

Residential Market Activity
In July 2025, 1,318 homes were sold across the OREB region. While this is down from 1,602 units in June, it represents a 4.9% increase over July 2024. Year-to-date, there have been 8,704 home sales, 3.1% higher than at the same point in 2024.

The average sale price for all homes sold in July was $695,209, up 2.2% from last year, while the year-to-date average stands at $702,840, a 3% increase over the first seven months of 2024. Total dollar volume of sales in July reached approximately $920 million, a 7.2% increase year-over-year.

On the listings side, 2,549 new residential properties were added in July, up 11.7% from last year. Active listings totaled 4,205 units, up 14% compared to July 2024 and 23.6% above the five-year average. Months of inventory rose slightly to 3.2, compared to 2.9 a year ago and 2.7 last month—indicative of a balanced market.

MLS® Home Price Index
The MLS® HPI composite benchmark price in Ottawa was $633,100 in July, a 1.9% increase year-over-year. By property type:

  • Single-family homes: $704,800, up 2%

  • Townhouses: $468,000, up 8.3%

  • Apartments: $411,900, down 1.6%

Source: members.oreb.ca

Read

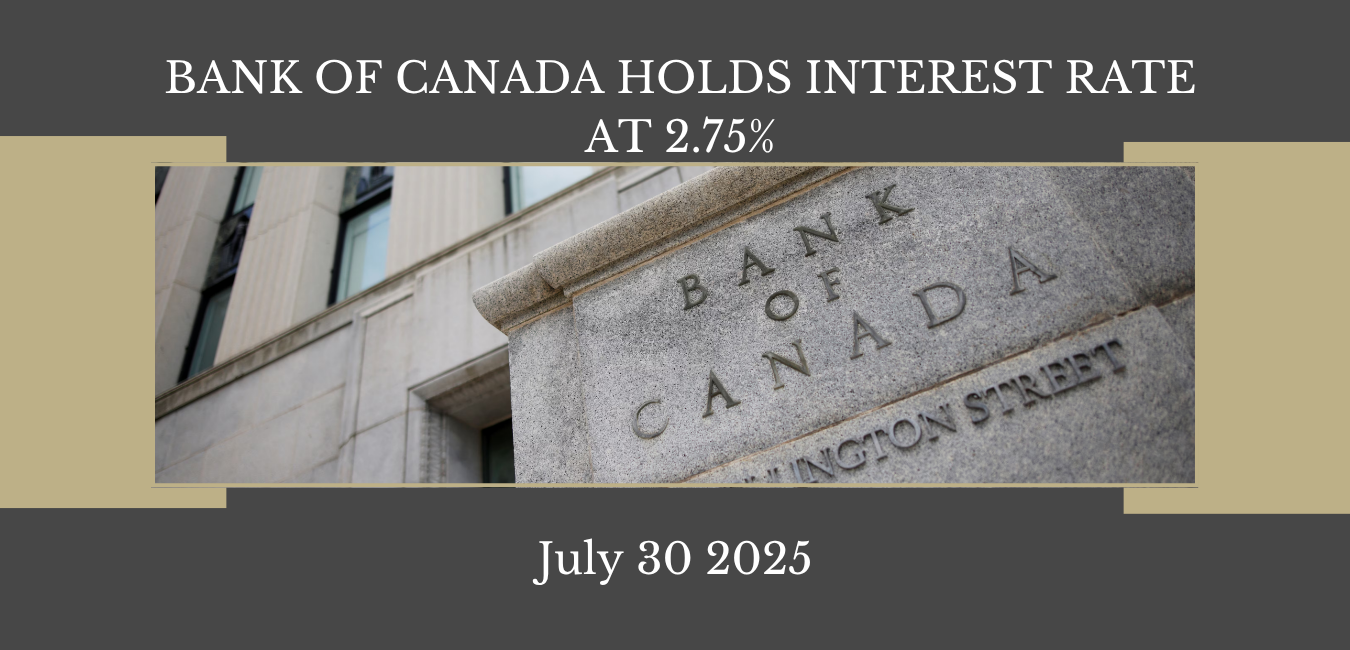
BoC Holds Key Interest Rate at 2.75%

The Bank of Canada has announced it will maintain its target for the overnight rate at 2.75%, with the Bank Rate at 3% and the deposit rate at 2.70%.

Global trade developments—particularly involving the United States—continue to create uncertainty. Although recent U.S. trade policies have begun to take clearer shape, the landscape remains unpredictable. The Bank’s July Monetary Policy Report (MPR) does not include traditional base-case projections for GDP and inflation due to this instability. Instead, it outlines a “current tariff scenario” based on tariffs confirmed as of July 27, along with two alternatives: one assuming further tariff escalation and another assuming de-escalation.

Despite the turbulence in trade flows, the global economy has shown a degree of resilience. In the United States, growth moderated in early 2025, though the labour market remains healthy. Notably, U.S. CPI inflation rose in June, with signs emerging that some tariffs are beginning to feed into consumer prices. The eurozone experienced modest economic expansion, while China’s exports to the U.S. have declined—a trend largely balanced by stronger exports to other regions.

Financial markets have also responded: global oil prices remain close to April levels, equity markets have moved higher, and corporate credit spreads have narrowed. Government bond yields have edged upward. Meanwhile, the Canadian dollar has appreciated, supported by a broadly weaker U.S. dollar.

In this current tariff scenario, global growth is expected to slow slightly to about 2.5% by the end of 2025, before recovering to around 3% in 2026–2027.

Read

Ottawa Real Estate Market Shows Stable Prices and Rising Inventory in June

OTTAWA, July 7, 2025 – A total of 1,602 homes were sold through the MLS® System of the Ottawa Real Estate Board (OREB) in June 2025. This represents an 11.34% decrease from the previous month, a 10.6% increase compared to June 2024, and sits 3.8% above the five-year average.*

“June was the busiest month we've seen in quite some time, with sales up 10.6% and new listings rising nearly 14% year over year, signifying we did, in fact, have a delayed spring market,” says OREB President Paul Czan. “We’re seeing more inventory hit the market, giving buyers more choice. With the changing market conditions, sellers need to be future-focused—pricing thoughtfully and preparing their homes to be one of the top picks in their area.”

“Apartments are one segment that continues to feel the strain, with sales down about 20% and inventory building. That’s partly due to an increase in new construction, but also a slowdown in immigration numbers,” adds Czan. “Still, Ottawa remains a stable market. We’re returning to familiar seasonal trends, where summer activity picks up for families looking to settle before the school year. With students returning to the city, a stronger fall is likely ahead.”

By the Numbers – Prices
The MLS® Home Price Index (HPI) tracks price trends more accurately than average or median price measures.

  • The overall MLS® HPI composite benchmark price in June 2025 was $634,300, up 1.6% from June 2024.

    • Single-family homes had a benchmark price of $707,600, up 1.6% year-over-year.

    • Townhouse/row units** saw a benchmark price of $467,900, a 9.0% increase from 2024.

    • Apartments had a benchmark price of $411,500, a 0.6% decline year-over-year.

  • The average price of homes sold in June 2025 was $723,152, a 5.2% increase over June 2024.

  • Total dollar volume of all home sales in June reached $1.15 billion, a 16.3% increase from the same period last year.

OREB cautions that while average sale prices can indicate trends over time, they should not be used to determine the value of specific properties, as prices vary by neighbourhood. Average price is calculated based on total dollar volume of all properties sold.

By the Numbers – Inventory & New Listings

  • New listings rose 13.8% from June 2024, with 2,933 residential properties added to the market—6.6% above the five-year average.

  • Active residential listings at the end of June totaled 4,350 units, up 11.6% from the same month last year and 42.6% above the five-year average.

  • Months of inventory remained steady at 2.7, unchanged from June 2024. This figure represents the number of months it would take to sell current inventories at the current sales pace.

Read

Ottawa Housing Market Sees Strong May Sales and Steady Prices

OTTAWA, June 6, 2025 – The Ottawa Real Estate Board (OREB) reports that 1,807 homes were sold through the MLS® System in May 2025. This represents a 33.1% increase over the previous month, a 14.9% rise compared to May 2024, and is 2.5% above the five-year average.*

“Year-to-date home sales activity remains in line with 2024; however, the 33.1% surge over April 2025 suggests we’re experiencing a delayed spring market,” says OREB President Paul Czan. “April’s federal election occupied consumers’ attention, and now we’re seeing a shift in the marketplace. Active listings are on the rise, months of inventory remain steady, and buyers appear to be regaining confidence, re-entering the market and completing transactions. For sellers, however, rising inventory means competitive pricing and strong presentation are more important than ever.”

“Compared to markets like Toronto or Vancouver, which are showing signs of stagnation, Ottawa is holding steady,” adds Czan. “Buyers and sellers are still able to transact fairly, with sale prices remaining close to list, even amid broader economic uncertainty. The Bank of Canada’s recent decision to hold the key interest rate steady may further encourage activity, as buyers feel more confident that rates will not drop further.”

By the Numbers – Prices
The MLS® Home Price Index (HPI) offers a more accurate reflection of price trends than average or median price measures.

  • The overall MLS® HPI composite benchmark price in May 2025 was $629,800, up 0.8% from May 2024.

    • Single-family homes had a benchmark price of $700,000, up 0.6% year-over-year.

    • Townhouse/row units** saw a benchmark price of $446,900, an increase of 3.4% from 2024.

    • Apartments had a benchmark price of $404,700, a 3.6% decline from last year.

  • The average price of homes sold in May 2025 was $728,623, a 4.8% increase over May 2024.

  • Total dollar volume of all home sales in May 2025 reached $1.316 billion, a 20.4% increase from the same period last year.

OREB cautions that while the average sale price can indicate trends over time, it should not be used to determine the value of specific properties, as prices vary by neighbourhood. The average price is calculated based on the total dollar volume of all properties sold.

By the Numbers – Inventory & New Listings

  • New listings rose 8.7% from May 2024, with 3,430 residential properties added to the market—15.8% above the five-year average.

  • Active residential listings reached 4,347 units at the end of May 2025, a 13.5% increase from May 2024 and 54.2% above the five-year average.

  • Months of inventory remained steady at 2.4, unchanged from the previous year. This figure represents the number of months it would take to sell current inventories at the current sales pace.

Read

Ottawa Real Estate Market Snapshot – April 2025

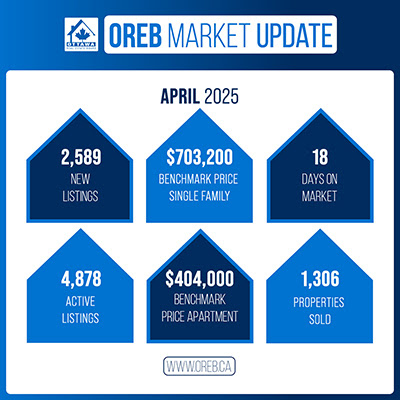
The spring market is gaining momentum in Ottawa, with notable shifts in both buyer and seller behaviour. According to the Ottawa Real Estate Board (OREB), a total of 1,306 homes were sold through the MLS® System in April 2025. While this represents a significant 18.4% increase over March 2025, it also marks an 11.2% decline compared to April 2024.

Sales activity for the month came in 17.6% below the five-year average and 16.2% below the 10-year average, indicating a slower pace when viewed from a longer-term perspective.

“While April sales were down year-over-year, we saw a healthy month-over-month increase—an encouraging sign of growing momentum as we move through the spring market,” says OREB President Paul Czan. “Inventory remains at higher levels compared to previous years, indicating a gradual move towards a balanced market.”

As market conditions shift, both buyers and sellers are adjusting their strategies.

“With more certainty following the federal election, buyers are returning with greater confidence—but they're proceeding cautiously, taking their time, including conditions in their offers, and being more selective,” adds Czan. “Sellers, meanwhile, are adjusting to longer days on market, which makes strategic pricing and thoughtful home preparation more important than ever. If the listing is priced well, shows well, it's moving—and in some cases, it’s even getting multiple offers. Looking ahead, we’ll be watching how the federal government’s recent housing commitments translate into action. Policies aimed at increasing supply, improving affordability, and supporting first-time buyers are welcome steps toward meaningful impact here in Ottawa.”


By the Numbers – Prices

The MLS® Home Price Index (HPI) provides a more accurate reflection of market trends than traditional average or median price measurements.

  • The overall MLS® HPI composite benchmark price was $631,200 in April 2025 — a 1.1% increase from April 2024.

  • The benchmark price for single-family homes reached $703,200, rising 1.0% year-over-year.

  • Townhouses/row units saw a more notable price gain, with a benchmark of $440,000, up 4.4% compared to April 2024.

  • Apartment-style properties experienced a decline, with the benchmark price at $404,000, down 2.8% from the previous year.

Meanwhile, the average sale price across all property types in April 2025 stood at $707,180, reflecting a modest 0.4% increase compared to April 2024. The total dollar volume of home sales amounted to $923.5 million, which represents a 10.8% decline year-over-year.


By the Numbers – Inventory and New Listings

Market supply continued to expand in April, offering more options for prospective buyers.

  • New listings totalled 2,589 residential properties, a 3.8% decrease compared to April 2024. However, this figure remains 2.8% above the five-year average and 5.6% above the 10-year average for April.

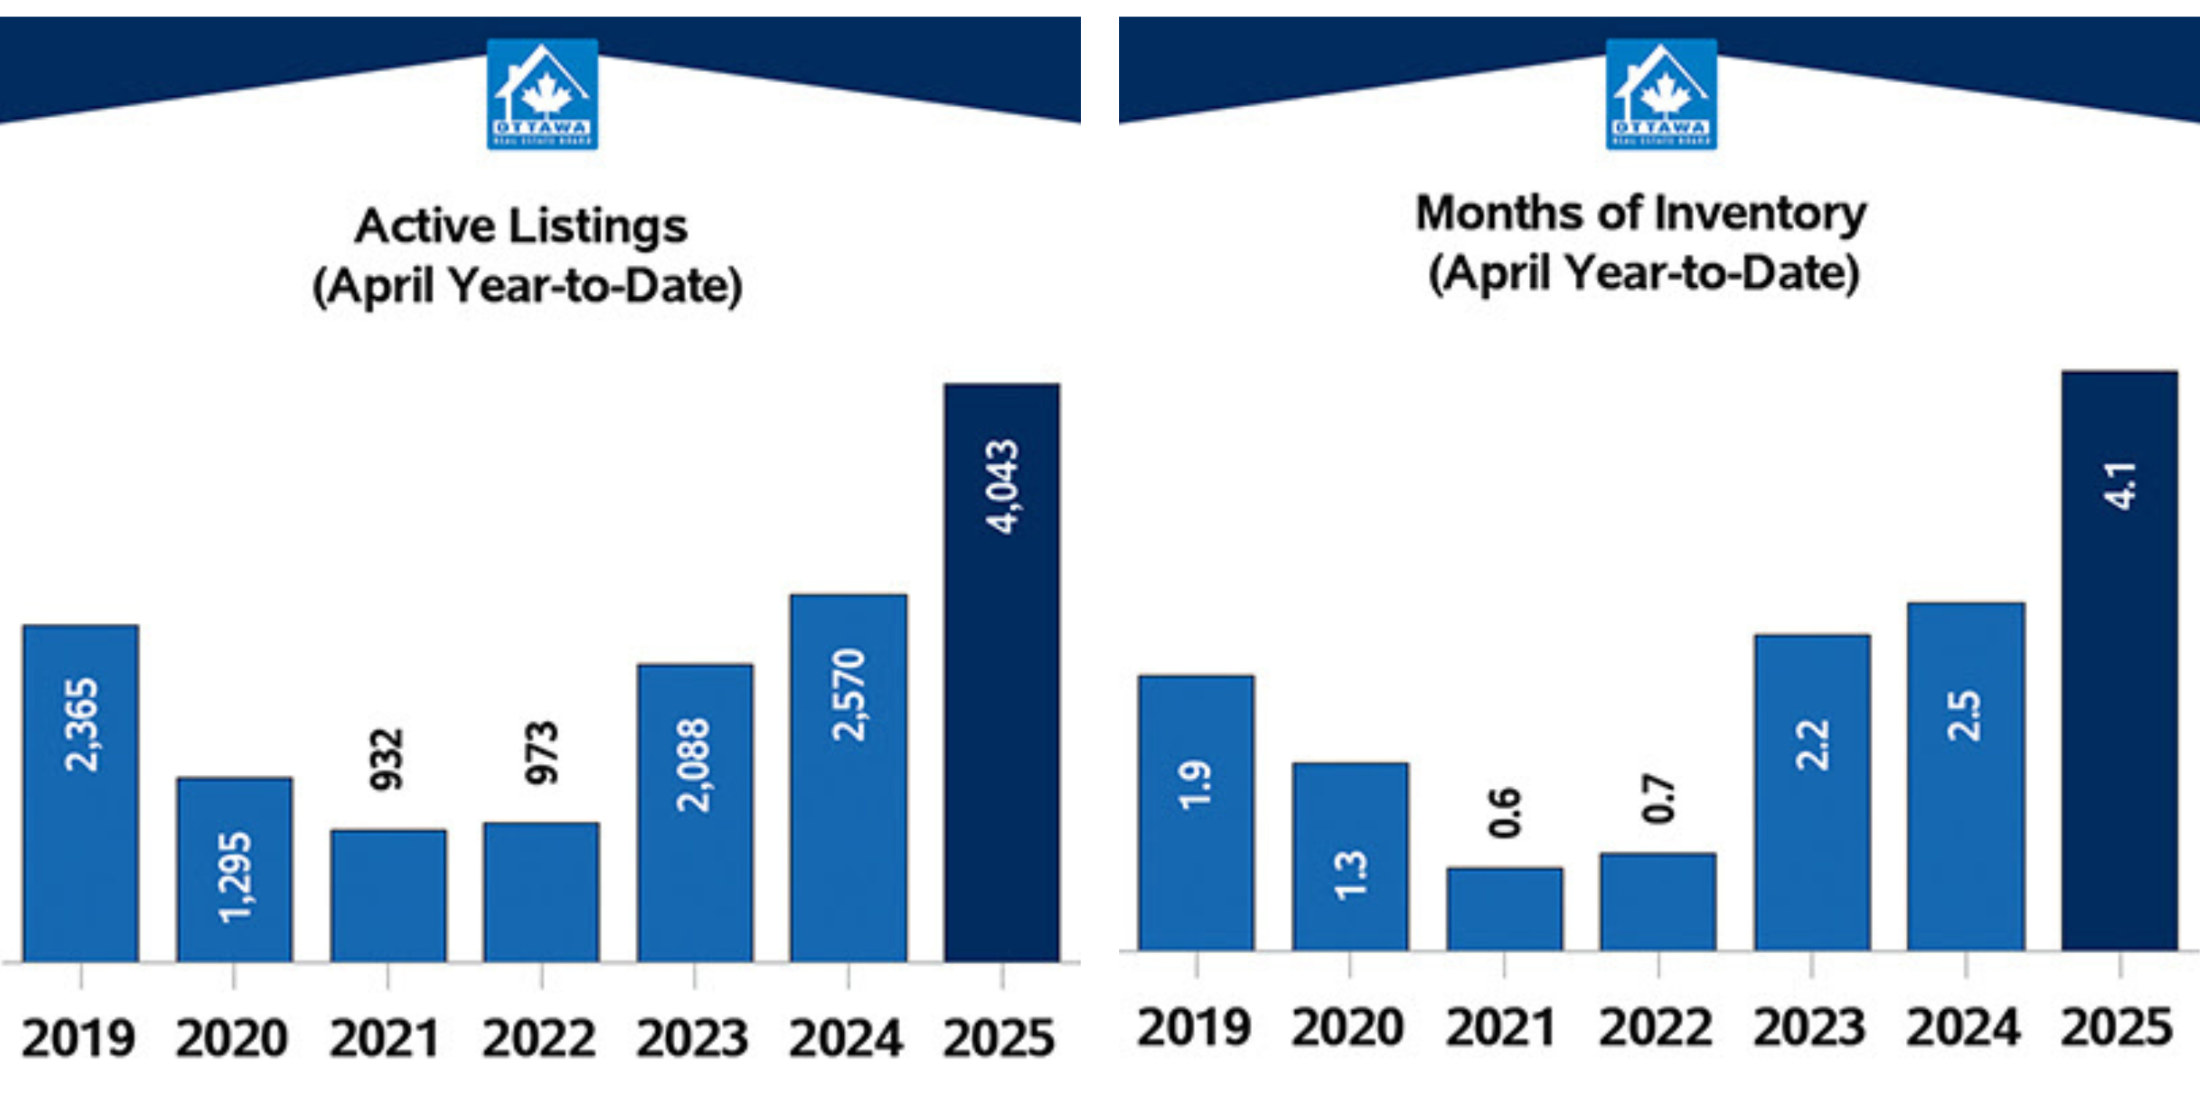
  • Active listings reached 4,878 units by the end of the month, a surge of 54.2% over last year. Inventory levels were 86.9% higher than the five-year average and 51.3% above the 10-year average.

  • The months of inventory—which measures how long it would take to sell all current listings at the current sales pace—stood at 3.7, up from 2.2 months in April 2024.


As Ottawa’s real estate market continues its transition toward more balanced conditions, buyers and sellers alike will benefit from working closely with knowledgeable REALTORS® who can help navigate pricing strategies, property preparation, and offer negotiations.

Stay tuned for more insights as we monitor how upcoming policy implementations and evolving market dynamics shape the remainder of the 2025 real estate landscape.

Source:OREB.ca

Read

Bank of Canada Holds Policy Rate Steady at 2.75%

In its latest interest rate announcement, the Bank of Canada has chosen to hold the overnight rate steady at 2.75%, with the Bank Rate set at 3.00% and the deposit rate at 2.70%.

This decision comes amid significant shifts in U.S. trade policy and growing uncertainty surrounding tariffs, which have collectively dampened global and domestic economic growth prospects while increasing inflation expectations. The April Monetary Policy Report (MPR) addresses this uncertainty by outlining two possible scenarios for U.S. trade policy moving forward.

  • In the first scenario, trade uncertainty remains high but tariffs are limited in scope. Under these conditions, Canadian economic growth is expected to weaken temporarily, while inflation holds close to the 2% target.

  • In the second scenario, a prolonged trade war drives the Canadian economy into recession this year, with inflation projected to rise temporarily above 3% in 2026.

The Bank notes that various trade policy outcomes are possible, and the level of uncertainty—both in terms of potential scenarios and their outcomes—is unusually high due to the rapid and unprecedented shifts in U.S. trade policy.

Globally, economic growth was solid at the end of 2024, and inflation had been easing towards central bank targets. However, rising trade tensions have since weighed heavily on the outlook. In the United States, signs of economic slowing have emerged amid elevated policy uncertainty and declining market sentiment. Inflation expectations have also risen. Meanwhile, euro area growth has been modest in early 2025, particularly impacted by a sluggish manufacturing sector. In China, the economy ended 2024 strong but has shown signs of slowing more recently.

Financial markets have experienced significant volatility due to ongoing tariff announcements, delays, and persistent threats of escalation. This turbulence has only added to existing uncertainty. Since January, oil prices have dropped significantly, driven largely by downgraded global growth expectations. The Canadian dollar has appreciated recently, primarily due to a broader weakening of the U.S. dollar.

Domestically, Canada’s economy is also feeling the impact. Tariff-related uncertainty has eroded both consumer and business confidence, contributing to weakness in consumer spending, residential investment, and business capital expenditures in the first quarter. The labour market recovery has also been disrupted, with a reported decline in employment in March and indications from businesses that hiring will slow. Wage growth is showing continued signs of moderation.

Inflation measured at 2.3% in March, slightly lower than February, but still up from 1.8% in January. This increase is largely attributed to a rebound in goods prices and the conclusion of the temporary GST/HST suspension. Looking ahead, the removal of the consumer carbon tax in April is expected to suppress CPI inflation over the next year. Additionally, lower global oil prices will exert downward pressure on inflation. However, tariffs and supply chain disruptions could push certain prices higher. The extent of this impact will depend on how tariffs evolve and how quickly businesses pass increased costs onto consumers. While short-term inflation expectations have risen, long-term expectations remain relatively unchanged.

The Bank’s Governing Council will continue to evaluate both the downward pressures on inflation arising from a slowing economy and the upward pressures caused by higher input costs. The primary focus remains on maintaining price stability and ensuring Canadians retain confidence in the central bank’s ability to manage inflation.

As we navigate this period of heightened global volatility, the Bank of Canada is proceeding cautiously, paying close attention to a range of economic risks. These include:

  • The potential reduction in demand for Canadian exports due to higher tariffs,

  • The possible knock-on effects on business investment, employment, and household spending,

  • The speed and extent to which businesses pass increased costs to consumers, and

  • The evolution of inflation expectations.

While monetary policy cannot directly resolve trade uncertainty, it plays a crucial role in safeguarding price stability and supporting economic resilience during challenging times.

Source: bankofcanada.ca

Read

Bank of Canada Lowers Interest Rate to 2.75% Amid Economic Uncertainty

The Bank of Canada today reduced its target for the overnight rate to 2.75%, with the Bank Rate at 3% and the deposit rate at 2.70%.

The Canadian economy entered 2025 in a solid position, with inflation close to the 2% target and robust GDP growth. However, heightened trade tensions and tariffs imposed by the United States will likely slow the pace of economic activity and increase inflationary pressures in Canada. The economic outlook continues to be subject to more-than-usual uncertainty because of the rapidly evolving policy landscape.

After a period of solid growth, the US economy looks to have slowed in recent months. US inflation remains slightly above target. Economic growth in the euro zone was modest in late 2024. China’s economy has posted strong gains, supported by government policies. Equity prices have fallen and bond yields have eased on market expectations of weaker North American growth. Oil prices have been volatile and are trading below the assumptions in the Bank’s January Monetary Policy Report (MPR). The Canadian dollar is broadly unchanged against the US dollar but weaker against other currencies.

Canada’s economy grew by 2.6% in the fourth quarter of 2024 following upwardly revised growth of 2.2% in the third quarter. This growth path is stronger than was expected at the time of the January MPR. Past cuts to interest rates have boosted economic activity, particularly consumption and housing. However, economic growth in the first quarter of 2025 will likely slow as the intensifying trade conflict weighs on sentiment and activity. Recent surveys suggest a sharp drop in consumer confidence and a slowdown in business spending as companies postpone or cancel investments. The negative impact of slowing domestic demand has been partially offset by a surge in exports in advance of tariffs being imposed.

Employment growth strengthened in November through January and the unemployment rate declined to 6.6%. In February, job growth stalled. While past interest rate cuts have boosted demand for labour in recent months, there are warning signs that heightened trade tensions could disrupt the recovery in the jobs market. Meanwhile, wage growth has shown signs of moderation.

Inflation remains close to the 2% target. The temporary suspension of the GST/HST lowered some consumer prices, but January’s CPI was slightly firmer than expected at 1.9%. Inflation is expected to increase to about 2½% in March with the end of the tax break. The Bank’s preferred measures of core inflation remain above 2%, mainly because of the persistence of shelter price inflation. Short-term inflation expectations have risen in light of fears about the impact of tariffs on prices.

While economic growth has come in stronger than expected, the pervasive uncertainty created by continuously changing US tariff threats is restraining consumers’ spending intentions and businesses’ plans to hire and invest. Against this background, and with inflation close to the 2% target, Governing Council decided to reduce the policy rate by a further 25 basis points.

Monetary policy cannot offset the impacts of a trade war. What it can and must do is ensure that higher prices do not lead to ongoing inflation. Governing Council will be carefully assessing the timing and strength of both the downward pressures on inflation from a weaker economy and the upward pressures on inflation from higher costs. The Council will also be closely monitoring inflation expectations. The Bank is committed to maintaining price stability for Canadians.

Source: www.bankofcanada.ca

Read

Ottawa Real Estate: February Sales Decline as Inventory Rises and Prices Hold Steady

A total of 809 homes were sold in February 2025 through the MLS® System of the Ottawa Real Estate Board (OREB), marking a 10.2% decrease compared to February 2024. Home sales were 19.1% below the five-year average and 15.4% lower than the 10-year average for February.

"Ottawa’s sales activity moderated while prices held steady," says OREB President Paul Czan. "Despite increased inventory, market uncertainty continues to influence buyer and seller decisions. Some sellers who had previously delayed listing are now entering the market, contributing to more options for buyers. While demand remains strong in certain price segments, the pace of sales varies, making strategic pricing and preparation key for sellers."

Czan adds, "The Bank of Canada’s influence on borrowing power, ongoing economic factors like tariffs, and the potential impact of upcoming elections are also shaping buyer and seller sentiment. As we approach the spring market, we anticipate increased buyer activity, particularly if interest rates trend downward and confidence continues to build."

By the Numbers – Prices:

The MLS® Home Price Index (HPI) provides a more accurate representation of price trends compared to average or median price calculations.

  • The overall MLS® HPI composite benchmark price in February 2025 was $658,300, reflecting a 4.4% increase from February 2024.

    • The benchmark price for a single-family home was $719,800, rising 1.3% year-over-year.

    • In contrast, the benchmark price for a townhouse/row unit dropped 11.6% to $438,000.

    • The benchmark price for an apartment reached $459,300, up 4.5% from the previous year.

  • The average home price in February 2025 was $669,945, reflecting a 1.4% increase from February 2024.

  • The total dollar volume of home sales in February 2025 was $541.9 million, down 8.9% from the same period last year.

OREB advises that while the average sale price can help identify trends over time, it should not be used to determine the value of specific properties. The average price is calculated based on the total dollar volume of all sales, and price trends will differ across neighbourhoods.

By the Numbers – Inventory & New Listings:

  • New listings increased 4.8% from February 2024, with 1,668 new residential properties added to the market. This was 10.8% above the five-year average and 6.7% above the 10-year average for February.

  • Active residential listings at the end of February 2025 totaled 3,735 units, a 61.4% surge compared to February 2024. Active listings were 95.7% above the five-year average and 51.4% higher than the 10-year average for February.

  • Months of inventory stood at 4.6 at the end of February 2025, up from 2.6 in February 2024. This metric represents how long it would take to sell all current listings at the current pace of sales.

Source:www.oreb.ca

Read

Ottawa’s Market Heats Up with Increased Listings and Cautious Buyers

A total of 617 homes were sold through the MLS® System of the Ottawa Real Estate Board (OREB) in January 2025, marking a 4.2% decline compared to January 2024.

Home sales fell 13% below the five-year average and 9.6% under the 10-year average for January.

“Ottawa’s market is seeing increased activity as more listings hit the market and buyers start to re-engage,” says OREB President Paul Czan. “Many buyers and sellers had been waiting for more conducive market conditions, but with the recent rate cut and potentially lower interest rates on the horizon, optimism is growing. While there’s more supply, the availability of suitable properties in various market segments remains tight. This is reflected in some homes selling quickly while others linger on the market. Sellers should be prepared to price competitively and present their homes in the best light to capture buyer interest in this evolving market."

“The recent Bank of Canada rate cut, introduction of U.S. tariffs, along with upcoming provincial and federal elections, introduce factors of variability,” adds Czan. “That said, confidence is growing, and more buyers are expected to return to the market in the coming months, leading to an increase in transactions.”

By the Numbers – Prices

The MLS® Home Price Index (HPI) provides a more precise measurement of price trends than average or median price calculations.

  • The overall MLS® HPI composite benchmark price stood at $649,900 in January 2025, reflecting a 5.2% increase from January 2024.

  • The benchmark price for single-family homes reached $713,000, up 2.3% year-over-year.

  • In contrast, the benchmark price for townhouse/row units declined 3.9% from the previous year to $448,000.

  • The benchmark price for apartments was $436,900, a 4.5% increase from January 2024.

  • The average sale price of homes in January 2025 was $670,258, a 5.8% rise from the previous year.

  • The total dollar volume of all home sales in January 2025 amounted to $413.5 million, reflecting a 1.3% increase compared to January 2024.

OREB advises that while the average sale price can highlight broader market trends over time, it should not be interpreted as an indicator of value changes for specific properties. The average price is derived from the total dollar volume of all sales, with prices varying across different neighbourhoods.

By the Numbers – Inventory and New Listings

  • New residential listings rose by 3.0% compared to January 2024, with 1,359 new properties hitting the market in January 2025. New listings were 14.1% above the five-year average and 9.3% higher than the 10-year average for January.

  • Active residential listings reached 3,312 units at the end of January 2025, marking a 57.3% increase from January 2024. Active listings were 90.6% higher than the five-year average and 48.9% above the 10-year average for January.

  • Months of inventory stood at 5.4 at the end of January 2025, compared to 3.3 in January 2024. This figure represents the number of months required to sell the current inventory at the existing rate of sales activity.

Thinking about buying or selling in Ottawa’s evolving market? Whether you're a buyer looking for the right opportunity or a seller wanting to position your home competitively, we're here to help you navigate the market with confidence.

Contact us today for expert advice and personalized guidance! Let's make your real estate goals a reality.

Read
This website may only be used by consumers that have a bona fide interest in the purchase, sale, or lease of real estate of the type being offered via the website. The data relating to real estate on this website comes in part from the MLS® Reciprocity program of the PropTx MLS®. The data is deemed reliable but is not guaranteed to be accurate.