

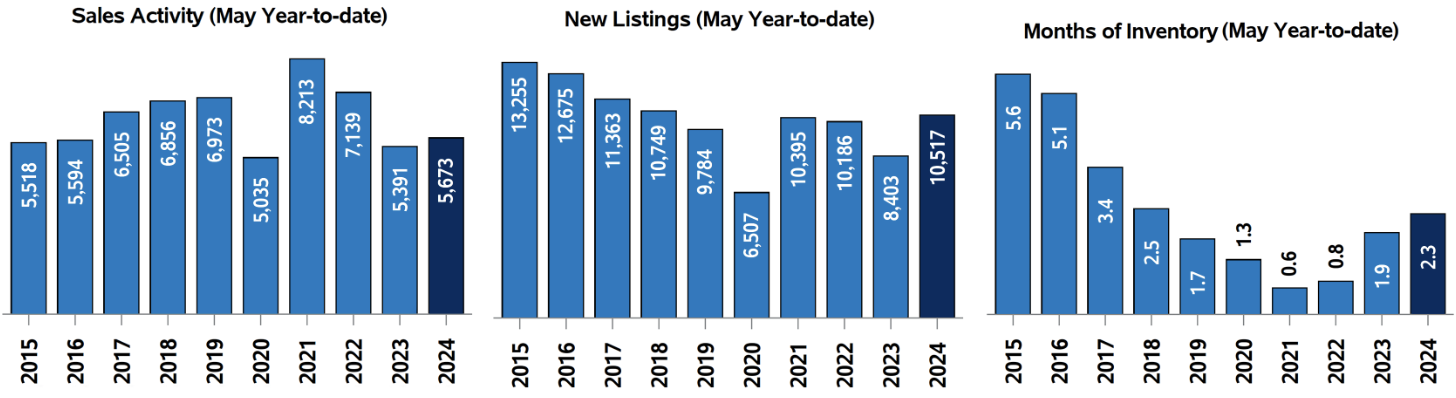
In May 2024, the Ottawa Real Estate Board (OREB) reported a total of 1,545 homes sold through the MLS® System, marking a 9.2% decrease compared to May 2023. This figure was 3.7% lower than the five-year average and 13.2% below the ten-year average for May. Year-to-date, home sales reached 5,673 units over the first five months of the year, reflecting a 5.2% increase from the same period in 2023.
OREB President Curtis Fillier noted that Ottawa's early spring market remained steady, with an increase in new listings indicating growing seller confidence. However, some sellers may have awaited the Bank of Canada's interest rate announcement before making decisions, as the first interest rate cut in four years occurred. Nevertheless, supply issues and high home prices persist as challenges despite positive economic indicators.
By the Numbers – Prices:
The MLS® Home Price Index (HPI) tracks price trends far more accurately than is possible using average or median price measures.
The overall MLS® HPI composite benchmark price was $651,300 in May 2024, a marginal gain of 1.2% from May 2023.
The benchmark price for single-family homes was $736,000, up 1.1% on a year-over-year basis in May.
By comparison, the benchmark price for a townhouse/row unit was $517,500, up 2.1% compared to a year earlier.
The benchmark apartment price was $425,000, up 2.0% from year-ago levels.
The average price of homes sold in May 2024 was $690,683 increasing 0.8% from May 2023. The more comprehensive year-to-date average price was $679,862, increasing by 1.8% from the first five months of 2023.
The dollar volume of all home sales in May 2024 was $1.06 billion, down 8.5% from the same month in 2023.
OREB cautions that the average sale price can be useful in establishing trends over time but should not be used as an indicator that specific properties have increased or decreased in value. The calculation of the average sale price is based on the total dollar volume of all properties sold. Prices will vary from neighbourhood to neighbourhood.
By the Numbers – Inventory & New Listings
The number of new listings saw an increase of 26.2% from May 2023. There were 3,034 new residential listings in May 2024. New listings were 23.2% above the five-year average and 10.2% above the 10-year average for the month of May.
Active residential listings numbered 3,552 units on the market at the end of May 2024, a gain of 59.4% from May 2023. Active listings were 72.2% above the five-year average and 2.9% below the 10-year average for the month of May.
Months of inventory numbered 2.3 at the end of May 2024, up from 1.3 in May 2023. The number of months of inventory is the number of months it would take to sell current inventories at the current rate of sales activity.
.png)
